Monitoring Memory, CPU and swap on RHEL or CentOS 7
top : The top provides a dynamic real-time view of running processes, CPU, Memory and SWAP utilization on a system. It can display system summary information as well as a list of processes or threads currently being managed by the Linux kernel.


swapon : It displays name of the swap device along with total/used size and it's priority:
[root@localhost ~]# swapon --show
NAME TYPE SIZE USED PRIO
/dev/dm-1 partition 3.9G 70.5M -2


[root@localhost ~]# top

In case as a root you want to check it for some particular user then :
[root@localhost ~]# top -u hpe

pmap : This command report memory map of a process or processes.
[root@localhost ~]# pmap -d 22745

vmstat : This command reports information about processes, memory, paging, block IO, traps, disks and cpu activity.
[root@localhost ~]# vmstat -w
[root@localhost ~]# vmstat -as
[root@localhost ~]# vmstat -dw

[root@localhost ~]# vmstat -D
5 disks
2 partitions
48470 total reads
104 merged reads
9879363 read sectors
6320494 milli reading
57453 writes
39762 merged writes
46514707 written sectors
61995147 milli writing
0 inprogress IO
1162 milli spent IO
mpstat : The mpstat command writes to standard output activities for each available processor, processor 0 being the first one. Global average activities among all processors are also reported. The mpstat command can be used both on SMP and UP machines, but in the latter, only global average activities will be printed. If no activity has been selected, then the default report is the CPU utilization report.
[root@localhost ~]# mpstat -A

free : free displays the total amount of free and used physical and swap memory in the system, as well as the buffers and caches used by the kernel. The information is gathered by parsing /proc/meminfo.
[root@localhost ~]# free -mlt

swapon : It displays name of the swap device along with total/used size and it's priority:
[root@localhost ~]# swapon --show
NAME TYPE SIZE USED PRIO
/dev/dm-1 partition 3.9G 70.5M -2
ps : This command gives you the list of running process on the system.
[root@localhost ~]# ps -eaf
UID PID PPID C STIME TTY TIME CMD
root 1 0 0 13:14 ? 00:00:08 /usr/lib/systemd/systemd --switched-root --system --deserialize 22
root 2 0 0 13:14 ? 00:00:00 [kthreadd]
root 3 2 0 13:14 ? 00:00:11 [ksoftirqd/0]
root 5 2 0 13:14 ? 00:00:00 [kworker/0:0H]
root 7 2 0 13:14 ? 00:00:07 [migration/0]
root 8 2 0 13:14 ? 00:00:00 [rcu_bh]
root 9 2 0 13:14 ? 00:00:08 [rcu_sched]
root 10 2 0 13:14 ? 00:00:00 [lru-add-drain]
root 11 2 0 13:14 ? 00:00:03 [watchdog/0]
root 12 2 0 13:14 ? 00:00:03 [watchdog/1]
root 13 2 0 13:14 ? 00:00:14 [migration/1]
root 14 2 0 13:14 ? 00:00:09 [ksoftirqd/1]
root 16 2 0 13:14 ? 00:00:00 [kworker/1:0H]
root 17 2 0 13:14 ? 00:00:04 [watchdog/2]
root 18 2 0 13:14 ? 00:00:19 [migration/2]
root 19 2 0 13:14 ? 00:00:03 [ksoftirqd/2]
root 20 2 0 13:14 ? 00:00:08 [kworker/2:0]
root 21 2 0 13:14 ? 00:00:00 [kworker/2:0H]
root 22 2 0 13:14 ? 00:00:06 [watchdog/3]
root 23 2 0 13:14 ? 00:00:24 [migration/3]
root 24 2 0 13:14 ? 00:00:27 [ksoftirqd/3]
root 26 2 0 13:14 ? 00:00:00 [kworker/3:0H]
Use of "--forest" switch in the ps command displays parent and chile process tree.
[root@localhost ~]# ps -e -o pid,args --forest

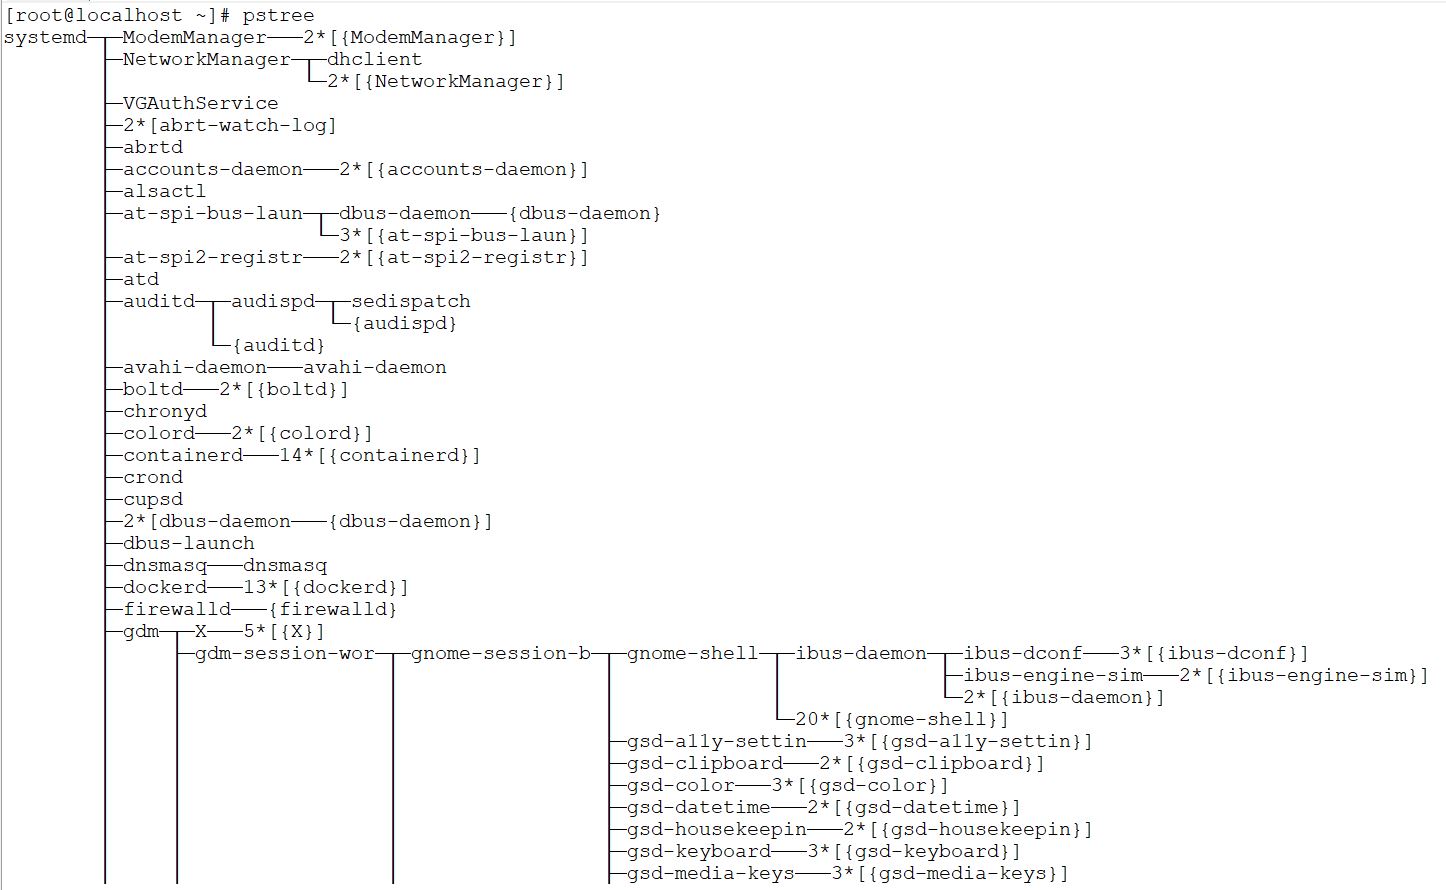
pstree : It shows running processes as a tree. The tree is rooted at either pid or init if pid is omitted. If a user name is specified, all process trees rooted at processes owned by that user are shown.
[root@localhost ~]# pstree
[root@localhost ~]# pstree -u hpe
bash───vim
bash───vim
lsof : This displays the lists of files currently opened on your system.
[root@localhost ~]# lsof | more

If you want to check list of opened files for some user:
[root@localhost ~]# lsof -u hpe

strace : Strace is used for debugging and troubleshooting the execution of an executable. It displays the system calls used by the process, and the signals received by the process. It also provides execution of a binary from start to end.
[root@localhost ~]# strace ls
execve("/usr/bin/ls", ["ls"], [/* 31 vars */]) = 0
brk(NULL) = 0x1b95000
mmap(NULL, 4096, PROT_READ|PROT_WRITE, MAP_PRIVATE|MAP_ANONYMOUS, -1, 0) = 0x7fe9a053f000
access("/etc/ld.so.preload", R_OK) = -1 ENOENT (No such file or directory)
open("/etc/ld.so.cache", O_RDONLY|O_CLOEXEC) = 3
fstat(3, {st_mode=S_IFREG|0644, st_size=122100, ...}) = 0
mmap(NULL, 122100, PROT_READ, MAP_PRIVATE, 3, 0) = 0x7fe9a0521000
close(3) = 0
open("/lib64/libselinux.so.1", O_RDONLY|O_CLOEXEC) = 3
read(3, "\177ELF\2\1\1\0\0\0\0\0\0\0\0\0\3\0>\0\1\0\0\0\320i\0\0\0\0\0\0"..., 832) = 832
fstat(3, {st_mode=S_IFREG|0755, st_size=155784, ...}) = 0
mmap(NULL, 2255184, PROT_READ|PROT_EXEC, MAP_PRIVATE|MAP_DENYWRITE, 3, 0) = 0x7fe9a00f8000
mprotect(0x7fe9a011c000, 2093056, PROT_NONE) = 0
mmap(0x7fe9a031b000, 8192, PROT_READ|PROT_WRITE, MAP_PRIVATE|MAP_FIXED|MAP_DENYWRITE, 3, 0x23000) = 0x7fe9a031b000
mmap(0x7fe9a031d000, 6480, PROT_READ|PROT_WRITE, MAP_PRIVATE|MAP_FIXED|MAP_ANONYMOUS, -1, 0) = 0x7fe9a031d000
close(3) = 0
open("/lib64/libcap.so.2", O_RDONLY|O_CLOEXEC) = 3
read(3, "\177ELF\2\1\1\0\0\0\0\0\0\0\0\0\3\0>\0\1\0\0\0 \26\0\0\0\0\0\0"..., 832) = 832
fstat(3, {st_mode=S_IFREG|0755, st_size=20032, ...}) = 0
.
.
.
well! Thanks for providing the information
ReplyDeleteDocker Training in Hyderabad
Kubernetes Training in Hyderabad
Docker and Kubernetes Training
Docker and Kubernetes Online Training
Mlishauex_hi Julie Ritter Download
ReplyDeleteringhandsoma
Aconsgipoeto Jay Sharp AirDroid 3.7.1.1
ReplyDeleteExposure X7 7.1.5.197 + Bundle
4K Video Downloader
Unreal Commander
lopapaber
Windows 7 Crack Download 2022 ; Windows 7 Professional Product Key 32-Bit. Windows 7 Professional Product Key 64-Bit ; 24437-XVJQQ-F36R3-7HM2B- .Windows 7 Ultimate Product Key
ReplyDelete