How to monitor disk performance on RHEL or CentOS 7 ?
How to monitor disk performance on RHEL or CentOS 7 ?
iotop : Watches I/O usage information output by the Linux kernel (requires 2.6.20 or later) and displays a table of current I/O usage by processes or threads on the system. At least the CONFIG_TASK_DELAY_ACCT, CONFIG_TASK_IO_ACCOUNTING, CONFIG_TASKSTATS and CONFIG_VM_EVENT_COUNTERS options need to be enabled in your Linux kernel build configuration. iotop displays columns for the I/O bandwidth read and written by each process/thread during the sampling period. It also displays the percentage of time the thread/process spent while swapping in and while waiting on I/O. For each process, its I/O priority (class/level) is shown.
[root@localhost ~]# iotop
Total DISK READ : 0.00 B/s | Total DISK WRITE : 0.00 B/s
Actual DISK READ: 0.00 B/s | Actual DISK WRITE: 0.00 B/s
TID PRIO USER DISK READ DISK WRITE SWAPIN IO> COMMAND
14856 be/4 root 0.00 B/s 0.00 B/s 0.00 % 0.08 % [kworker/3:0]
1 be/4 root 0.00 B/s 0.00 B/s 0.00 % 0.00 % systemd --switched-root --system --deserialize 22
2 be/4 root 0.00 B/s 0.00 B/s 0.00 % 0.00 % [kthreadd]
3 be/4 root 0.00 B/s 0.00 B/s 0.00 % 0.00 % [ksoftirqd/0]
5 be/0 root 0.00 B/s 0.00 B/s 0.00 % 0.00 % [kworker/0:0H]
6 be/4 root 0.00 B/s 0.00 B/s 0.00 % 0.00 % [kworker/u256:0]
7 rt/4 root 0.00 B/s 0.00 B/s 0.00 % 0.00 % [migration/0]
8 be/4 root 0.00 B/s 0.00 B/s 0.00 % 0.00 % [rcu_bh]
9 be/4 root 0.00 B/s 0.00 B/s 0.00 % 0.00 % [rcu_sched]
10 be/0 root 0.00 B/s 0.00 B/s 0.00 % 0.00 % [lru-add-drain]
11 rt/4 root 0.00 B/s 0.00 B/s 0.00 % 0.00 % [watchdog/0]
12 rt/4 root 0.00 B/s 0.00 B/s 0.00 % 0.00 % [watchdog/1]
13 rt/4 root 0.00 B/s 0.00 B/s 0.00 % 0.00 % [migration/1]
14 be/4 root 0.00 B/s 0.00 B/s 0.00 % 0.00 % [ksoftirqd/1]
10925 be/4 hpe 0.00 B/s 0.00 B/s 0.00 % 0.00 % gsd-xsettings [dconf worker]
16 be/0 root 0.00 B/s 0.00 B/s 0.00 % 0.00 % [kworker/1:0H]
17 rt/4 root 0.00 B/s 0.00 B/s 0.00 % 0.00 % [watchdog/2]
18 rt/4 root 0.00 B/s 0.00 B/s 0.00 % 0.00 % [migration/2]
19 be/4 root 0.00 B/s 0.00 B/s 0.00 % 0.00 % [ksoftirqd/2]
iostat : It report CPU statistics and IO statistics for devices and partitions. This command is used for monitoring system input/output device loading by observing the time devices are active in relation to their average transfer rates. The iostat command generates reports that can be used to change system configuration to better balance the input/output load between physical disks.
[root@localhost ~]# iostat
Linux 3.10.0-957.el7.x86_64 (localhost.localdomain) Friday 29 March 2019 _x86_64_ (4 CPU)
avg-cpu: %user %nice %system %iowait %steal %idle
0.84 0.91 1.70 0.94 0.00 95.61
Device: tps kB_read/s kB_wrtn/s kB_read kB_wrtn
sda 16.88 426.35 198.58 1477954 688381
scd0 0.01 0.30 0.00 1050 0
dm-0 16.66 415.36 197.98 1439850 686291
dm-1 0.03 0.71 0.00 2460 0
To check iostats on /dev/sda:
[root@localhost ~]# iostat -p sda
Linux 3.10.0-957.el7.x86_64 (localhost.localdomain) Friday 29 March 2019 _x86_64_ (4 CPU)
avg-cpu: %user %nice %system %iowait %steal %idle
0.79 0.85 2.01 1.01 0.00 95.34
Device: tps kB_read/s kB_wrtn/s kB_read kB_wrtn
sda 19.93 404.65 185.43 1584346 726011
sda1 0.52 8.15 0.53 31892 2090
sda2 19.41 396.08 184.89 1550782 723921
To check detailed stats:
[root@localhost ~]# iostat -x
Linux 3.10.0-957.el7.x86_64 (localhost.localdomain) Friday 29 March 2019 _x86_64_ (4 CPU)
avg-cpu: %user %nice %system %iowait %steal %idle
0.72 0.57 1.58 0.74 0.00 96.39
Device: rrqm/s wrqm/s r/s w/s rkB/s wkB/s avgrq-sz avgqu-sz await r_await w_await svctm %util
sda 0.03 0.37 12.37 1.45 274.77 137.89 59.72 0.18 13.40 6.47 72.30 3.92 5.41
scd0 0.00 0.00 0.00 0.00 0.18 0.00 72.41 0.00 1.72 1.72 0.00 1.31 0.00
dm-0 0.00 0.00 12.02 1.82 268.25 137.54 58.63 0.24 17.31 6.65 87.75 3.90 5.39
dm-1 0.00 0.00 0.02 0.00 0.42 0.00 54.67 0.00 0.20 0.20 0.00 0.11 0.00
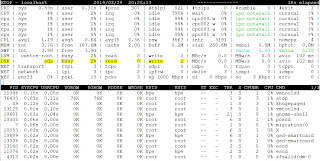
atop : atop is a Advanced System & Process Monitoring tool, which displays live status of the critical hardware resources (from a performance point of view) on system level, i.e. cpu, memory, disk and network in a arranged manner.
NOTE: To install this tool you will have to install EPEL repository and download it separately as it doesn't comes with RHEL or CentOS OS ISO's.
To install EPEL on CentOS and atop:
[root@localhost ~]# yum --enablerepo=extras install epel-release
[root@localhost ~]# yum install atop
To run atop :
[root@localhost ~]# atop
ioping : This tool generates various I/O patterns and lets you monitor I/O speed and latency in real time.
NOTE: To install this tool you will have to install EPEL repository and download it separately as it doesn't comes with RHEL or CentOS OS ISO's.
To install EPEL on CentOS and ioping:
[root@localhost ~]# yum --enablerepo=extras install epel-release
[root@localhost ~]# yum install ioping
To run ioping :
[root@localhost ~]# ioping -c 10 .
4 KiB <<< . (xfs /dev/dm-0): request=1 time=236.0 us (warmup)
4 KiB <<< . (xfs /dev/dm-0): request=2 time=496.4 us
4 KiB <<< . (xfs /dev/dm-0): request=3 time=592.1 us
4 KiB <<< . (xfs /dev/dm-0): request=4 time=630.0 us
4 KiB <<< . (xfs /dev/dm-0): request=5 time=384.8 us
4 KiB <<< . (xfs /dev/dm-0): request=6 time=696.7 us
4 KiB <<< . (xfs /dev/dm-0): request=7 time=1.22 ms (slow)
4 KiB <<< . (xfs /dev/dm-0): request=8 time=580.1 us
4 KiB <<< . (xfs /dev/dm-0): request=9 time=778.8 us
4 KiB <<< . (xfs /dev/dm-0): request=10 time=726.6 us
--- . (xfs /dev/dm-0) ioping statistics ---
9 requests completed in 6.11 ms, 36 KiB read, 1.47 k iops, 5.76 MiB/s
generated 10 requests in 9.01 s, 40 KiB, 1 iops, 4.44 KiB/s
min/avg/max/mdev = 384.8 us / 678.6 us / 1.22 ms / 222.8 us
[root@localhost ~]# ioping -c 10 -i 5 -s 16k .
16 KiB <<< . (xfs /dev/dm-0): request=1 time=374.2 us (warmup)
16 KiB <<< . (xfs /dev/dm-0): request=2 time=732.5 us
16 KiB <<< . (xfs /dev/dm-0): request=3 time=932.0 us
16 KiB <<< . (xfs /dev/dm-0): request=4 time=574.3 us
16 KiB <<< . (xfs /dev/dm-0): request=5 time=667.4 us
16 KiB <<< . (xfs /dev/dm-0): request=6 time=588.0 us
16 KiB <<< . (xfs /dev/dm-0): request=7 time=903.8 us
16 KiB <<< . (xfs /dev/dm-0): request=8 time=666.1 us
16 KiB <<< . (xfs /dev/dm-0): request=9 time=886.9 us
16 KiB <<< . (xfs /dev/dm-0): request=10 time=594.5 us
--- . (xfs /dev/dm-0) ioping statistics ---
9 requests completed in 6.55 ms, 144 KiB read, 1.37 k iops, 21.5 MiB/s
generated 10 requests in 45.0 s, 160 KiB, 0 iops, 3.55 KiB/s
min/avg/max/mdev = 574.3 us / 727.3 us / 932.0 us / 135.9 us
NOTE:
-c Stop after count requests
-i Set time between requests to interval (Default 1s)
-s Request size (Default 4k)


Very informative and impressive post you have written, this is quite interesting and i have went through it completely, an upgraded information is shared, keep sharing such valuable information. File I/O Monitor
ReplyDelete